Wall Street’s Rear-View Mirror
I have observed a structural lag: most US equities are held by institutions like Wall Street, who — by virtue of regulatory requirements and the “manager-paid-by-mixed-base-and-bonus” role — react slowly with substantial inertia. Specifically, even when something is obvious, they wait for earnings certainty before deploying serious capital, rather than positioning early. In the 2023–2026 AI capex cycle this lag has been amplified into an industry-chain relay race — leg 1 is GPU (NVDA), leg 2 is power (VST / CEG), leg 3 is memory (MU / SK Hynix), leg 4 is networking (ANET / AVGO), leg 5 is CPU (AMD / INTC), and each leg lags the previous by 12–24 months. This note follows four questions: ① who actually holds US stocks → ② why are institutions slow → ③ how is the relay race ordered → ④ can retail exploit this window, and when does the playbook break.
Premise — Wall Street is the rear-view mirror

Image: Wikimedia Commons · Public Domain.
“Wall Street is the rear-view mirror” isn’t rhetoric — it’s a structural fact about institutional capital. A typical active manager who wants to add a new position to the investment-committee agenda needs not “I believe this industry is about to take off,” but “the past 2–3 quarters of earnings have already validated the take-off.” The former gets blocked by compliance; only the latter can enter the model portfolio.
This “wait for the numbers” mechanism is fine most of the time — because most of the time industries don’t turn on a dime. But once a black-swan like ChatGPT hits, “the numbers” only catch up to “the facts” in quarterly increments. The 6–12 months in between are the reaction window institutional inertia creates.
Institutions aren’t blind, they just can’t move when they see — seeing ≠ being able to write it into an IC memo, being writeable into an IC memo ≠ being able to enter the model portfolio, being in the model portfolio ≠ being able to scale to a 5% position. Each step demands quarterly numbers, each step eats months.
The relay race · what this observation looks like concretely
A further point: institutions’ “wait for numbers” habit is not evenly distributed — it lags more on the legs of the value chain whose earnings reflect later. The AI relay order is crystal clear:
- Leg 1 (2023) · GPU (NVDA) — took off immediately after ChatGPT because NVDA’s revenue guidance gave a direct signal within six months.
- Leg 2 (2024) · Power (VST, CEG) — the physical fact of data-center power draw took about 18 months to show up in power equities.
- Leg 3 (2024 late → 2025) · Memory (MU, SK Hynix) — HBM price hikes were industrially clear by mid-2024, but MU’s margin improvement only showed up in Q4 2024 earnings.
- Leg 4 (2025) · Networking (ANET, AVGO) — AI back-end networking moved from “accessory” to “standalone lane” only after ANET solidified $750M of AI back-end network revenue.
- Leg 5 (2025 Q4 → ) · CPU (AMD, INTC) — server CPUs only started moving in Q4 2025: prices +30%, AMD lead times stretching from 8 to 10+ weeks, yet the market still values INTC under the 2024 “Intel in decline” narrative.
— The point isn’t “institutions are stupid,” they aren’t; it’s “institutions are constrained” — and the constraints are structurally observable and structurally exploitable.
Who holds — 80% institutional, 20% retail
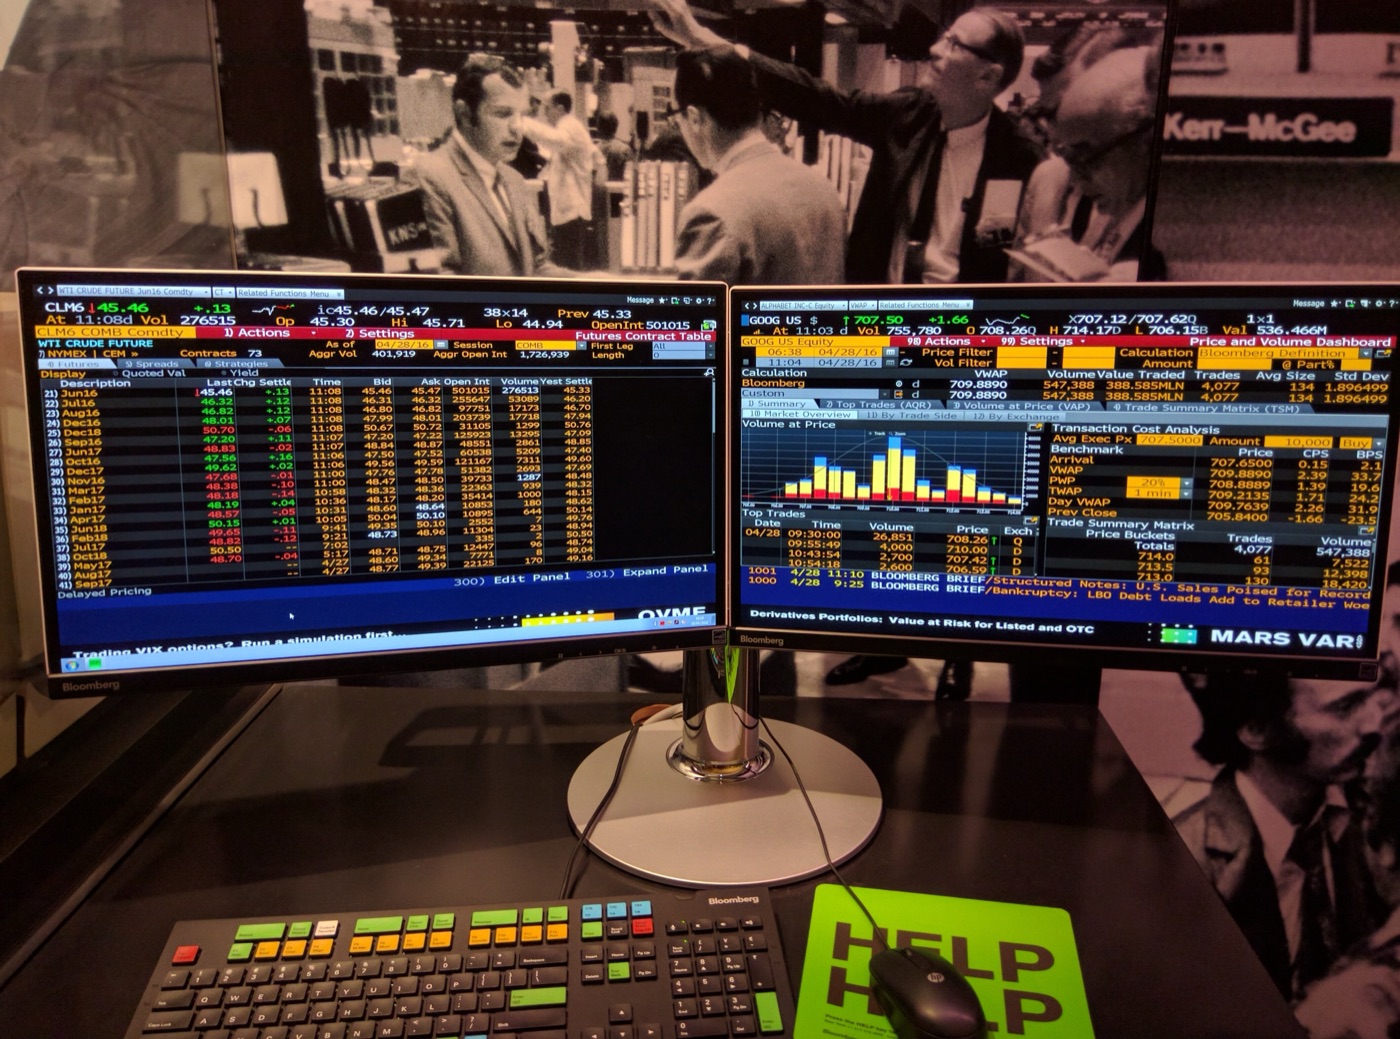
Image: Wikimedia Commons · CC BY-SA 4.0.
First set out the shareholding structure of US equities, the premise for this whole analysis.
| Dimension | Institutional | Retail | Note |
|---|---|---|---|
| S&P 500 large-cap ownership share | ~80% | ~20% | Institutions cover large caps more deeply; retail share is higher in small caps (IR Impact) |
| Investment-advisor class holdings (S&P 500) | 38% | — | BlackRock + Vanguard + State Street (Voronoi) |
| Share of S&P 500 firms where Big Three is the largest shareholder | 88% | — | A side-effect of passive ETFs — votes + signals converge |
| 2025 H1 net buying of US stocks (retail + ETF) | — | $155.3B | All-time H1 record (JPMorgan Institute) |
| 2025-07 retail order-flow share | — | 12.6% | Historically high |
| 2024 % of accounts underperforming the S&P 500 (institutional) | 69% | — | Active managers gross of fees (SPIVA U.S.) |
| 10-year underperformance vs. benchmark | 80%+ | — | Active equity funds net of fees |
Two non-obvious facts:
- Institutions are the majority of the market, and also the majority that underperforms the market. Sounds like a paradox — how can 80% of capital underperform the index made up of 80% of capital? The answer is “fee drag + over-diversification driven by benchmark anxiety.” Big Three is the largest shareholder in 88% of S&P 500 firms, meaning “the index” itself is the arithmetic mean of institutional capital; active managers underperforming the benchmark aren’t losing to retail — they are losing to a passive-ized version of themselves.
- Retail is overweighted in order flow but underweighted in holdings. Retail was 12.6% of order flow in Q3 2025 (a high), but only ~20% of total holdings — meaning retail turnover is much higher than institutions’, who “lock” capital in place and turn it over much more slowly. This is itself a quantitative expression of “inertia.”
An interesting detail: the institutional objective has never been “beat the market,” it has been “don’t get fired.” These two goals align 80% of the time, but diverge sharply during the 6–12 months around inflection points. Retail’s edge appears precisely in this divergence.
Three constraints — why institutional money is structurally slow
Institutional “slowness” isn’t a cognition problem and isn’t a “they didn’t see it” problem. It’s a structural problem — three layers of constraints pin institutional capital in place.
Constraint 1 · Regulation + fiduciary duty
- Diversification mandate. 401(k) / pension funds / endowments are broadly bound by ERISA / prudent man rule, which require reasonable diversification and avoidance of “concentrated holdings.” A manager can’t go 25% in NVDA because they personally like it — that violates prudent man rule even if it works out.
- Approval workflow. A single large position change typically needs Investment Committee (IC) approval, on a weekly cadence.
- Disclosure mandate. 13F filings make institutional repositioning “semi-transparent”; a major position-build itself becomes a market signal, throttling the very pace of repositioning.
Constraint 2 · Benchmark anxiety (career risk)
- Pay tied to benchmark. Active managers’ management + performance fees presume “beat the index” — so anything that materially deviates from the benchmark is asymmetric risk: downside when wrong dwarfs upside when right.
- “No one ever got fired for buying NVIDIA.” This is the 2026 version of no one ever got fired for buying IBM. Once NVDA is in every research report, buying NVDA is zero career risk; not buying NVDA is career risk. So institutions only start adding NVDA after it has already 5x’d — defensively matching the benchmark, not chasing alpha.
- Outcome: momentum, not contrarianism. Institutions play momentum-follower in “obvious” lanes and avoid bets in “non-obvious” lanes. That’s why memory, power, and CPU — the “next legs” — always lag the first leg.
Constraint 3 · Agency problem
- It’s not their money. Managers invest LP / client money, so the implicit objective is “average outperformance + no surprises” — not “maximize expected return.”
- Riding the wave is “appropriate,” catching a falling knife is “risky.” Positioning ahead of an inflection = risky (wrong → redemptions); chasing certainty up = responsible (wrong → everybody was wrong). Post-hoc accountability for these two situations is completely asymmetric.
- Holding period locked by LPs. Even if a hedge fund’s view is 5 years long, the LP mandate is monthly redemption — managers instinctively won’t place “3-year payoff” bets.
SPIVA data: in 2024, 69% of institutional accounts and 67% of wrap accounts underperformed the S&P 500 (gross of fees); 10-year, 80%+ of active equity funds underperform the benchmark net of fees. Not an exception — a structural outcome.
— Put the three constraints together and institutional lag isn’t individual choice, it’s institutional design.
AI value-chain relay race — evidence in the data
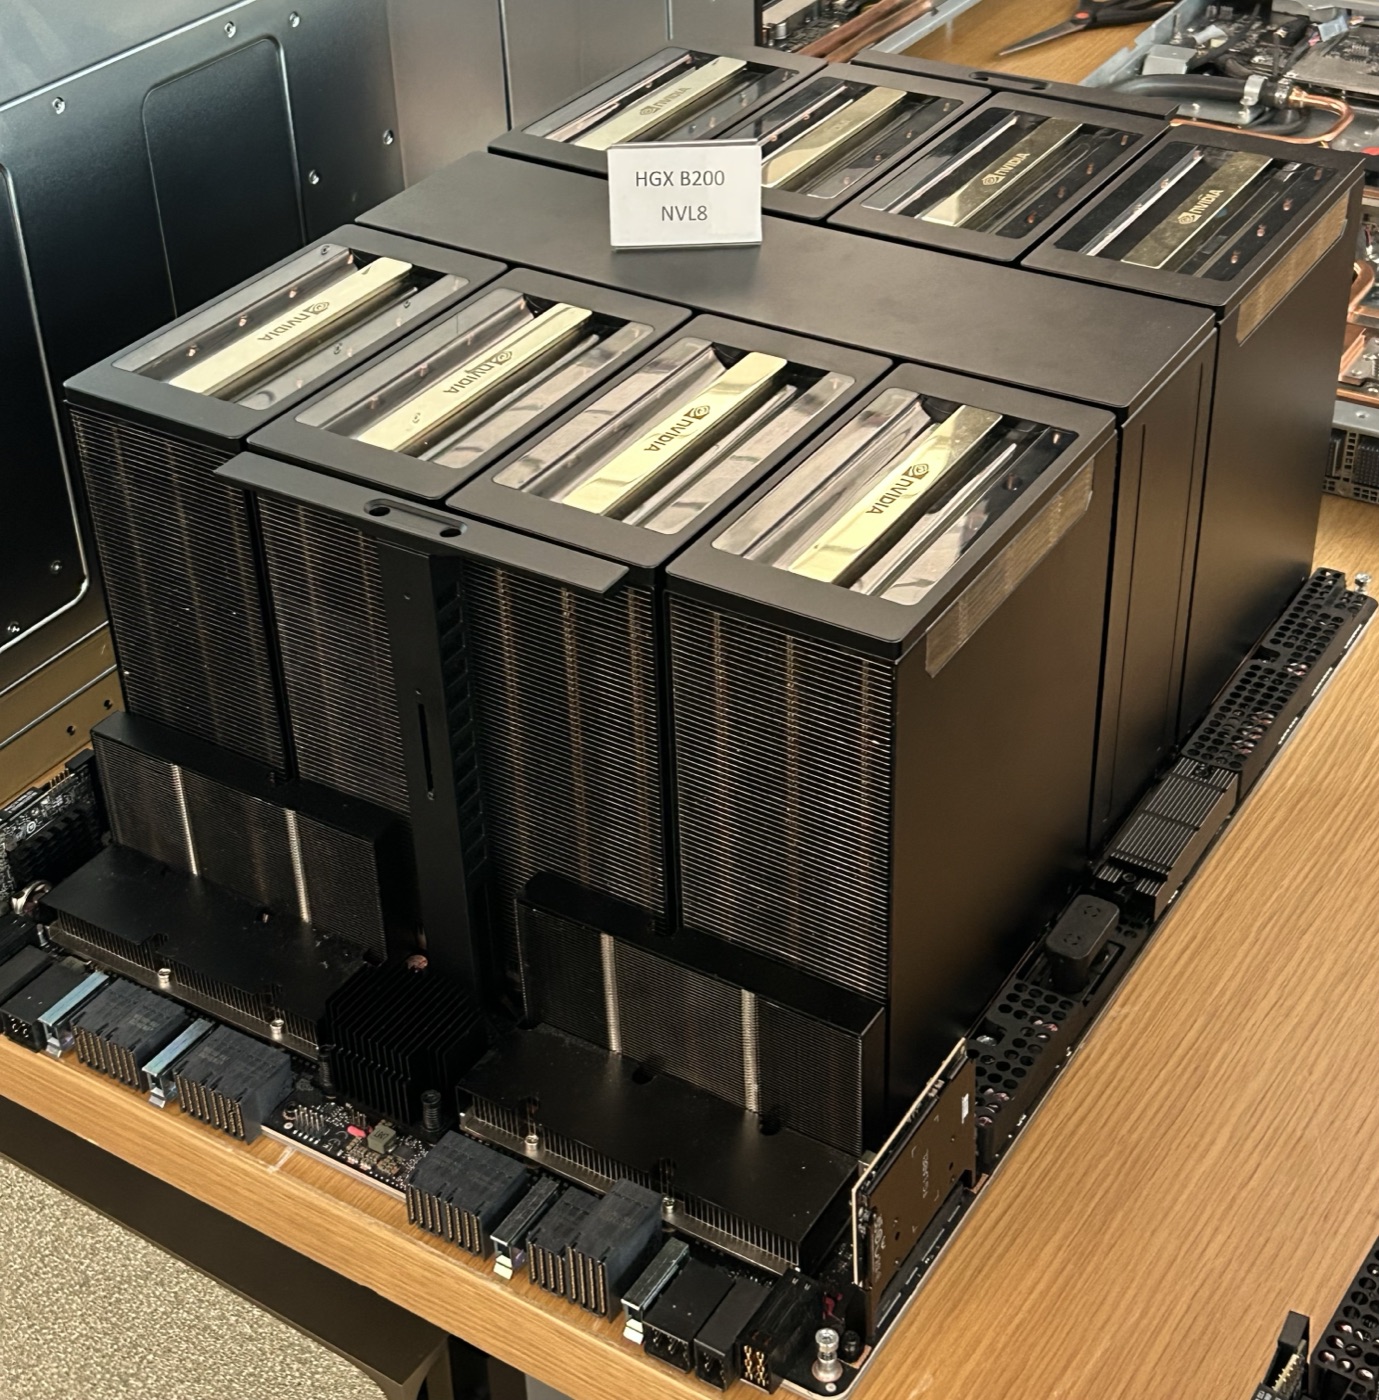
Image: Wikimedia Commons / NVIDIA · Public Domain.
Pull out the relay order of the NVDA-led AI capex wave, and the trajectory of institutional lag becomes obvious.
AI Value-Chain Relay · stock price normalized (2023-01 = 100)
Leg 1 NVDA took off in 2023, +171% in 2024; leg 2 VST +264% in 2024, CEG +150%; leg 3 MU +239% in 2025 (~18–24 months after NVDA’s take-off); leg 4 ANET / AVGO followed in 2025; leg 5 INTC only started moving in Q4 2025. Each leg lags the prior by 12–24 months — the canonical rhythm of institutional “wait for numbers.”
Relay order · the key numbers for each leg
| Leg | Names | Start | Industry fact | Earnings reflection |
|---|---|---|---|---|
| 1 | NVDA (GPU) | 2023 Q1 | ChatGPT ignites training capex | FY24 data center $47.5B, FY26 $194B, +89% YoY |
| 2 | VST · CEG (power) | 2024 Q3 | 100–300MW single-site data-center power draw | VST 2024 +264%, CEG 2024 +150%; TMI restart for MSFT (2024-09) |
| 3 | MU · SK Hynix (memory) | 2024 Q4 → 2025 | HBM3E 12-high in chronic shortage | MU Q1 FY26 $13.64B, +57% YoY, GM 56.8%; SK Hynix 2025 profit doubled, surpassing Samsung |
| 4 | ANET · AVGO (networking) | 2025 | AI back-end networking from “accessory” to standalone lane | ANET 2024 $7B → 2025 $9B; AVGO AI FY25 $19.9B, +63% YoY |
| 5 | AMD · INTC (CPU) | 2025 Q4 → ? | Server CPU shortage; Intel sacrificing client to Xeon | Q4 server CPU prices +30%; AMD lead time 8 → 10+ weeks; market still pricing 2024 decline narrative |
Four non-obvious insights
- The time stagger is crystal clear. NVDA took off in 2023; at the same time MU was losing money (negative GM in FY23 Q2). MU’s real take-off came in late-2024 to 2025, lagging NVDA by 18–24 months. Not “the market didn’t see it” — but “the memory earnings number wasn’t pretty yet” — and institutions need numbers to back the call. HBM pricing was clearly industrially set by mid-2024, but MU’s margin improvement in the earnings line had to wait until Q4 2024 — the 6-month gap is the institutional-lag window.
- Upstream leads downstream; specialized leads general-purpose. GPU (mid-stream · specialized) → power (upstream · infrastructure) → HBM (upstream · component · specialized) → networking (mid-stream · transmission) → CPU (downstream · general-purpose compute). Each leg needs 6–12 months of full pricing because institutions need “this leg’s earnings number to also confirm” before rotating.
- “The most obvious next step” is often the least priced. “Data centers need power”; “data centers need memory” — both were public knowledge a month after ChatGPT. But VST took 18 months and MU 24 months to take off. The reason isn’t “nobody thought of it,” it’s “even when they did, they couldn’t write it into an IC memo because forward earnings hadn’t improved yet.”
- The CPU leg hasn’t fully run. Q4 2025 server CPU prices rose 30%, AMD lead times stretched from 8 to 10+ weeks, and Intel said explicitly in Q4 earnings that “Xeon shipments come first, client gives way” — all of which is “industry fact already happened.” But INTC’s current valuation is still anchored in the 2024 Intel is dying narrative (market share dropped from 68% to 6%). When institutions start writing “AI also needs general-purpose compute” into IC memos, that is the next leg of the relay.
Data-center revenue · GPU vs Memory vs CPU
NVDA data center $47.5B → $115B → $194B (+89% YoY; FY26 single-quarter $62B). MU DC roughly $8B → $20.75B → est. $35B+ (+137% YoY in FY25). INTC DC 16–17 → 17 (stagnant 2 years); AMD DC 12.6 → 16.6 → est. 22. NVDA data-center revenue is 6x the sum of Intel + AMD. The physical evidence of institutional lag — within the same capex cycle, the GPU-side earnings ran 4–8 quarters ahead of the CPU-side.
“The obvious fact reflects first in the leading GPU stock, then in upstream (memory / HBM), then in infrastructure (power / networking), and only finally in CPU, the ‘seemingly not yet exploded’ part. Each leg trails the prior by 12–24 months.”
— this is the value-chain projection of institutional inertia
Retail’s reaction edge — how to use this window
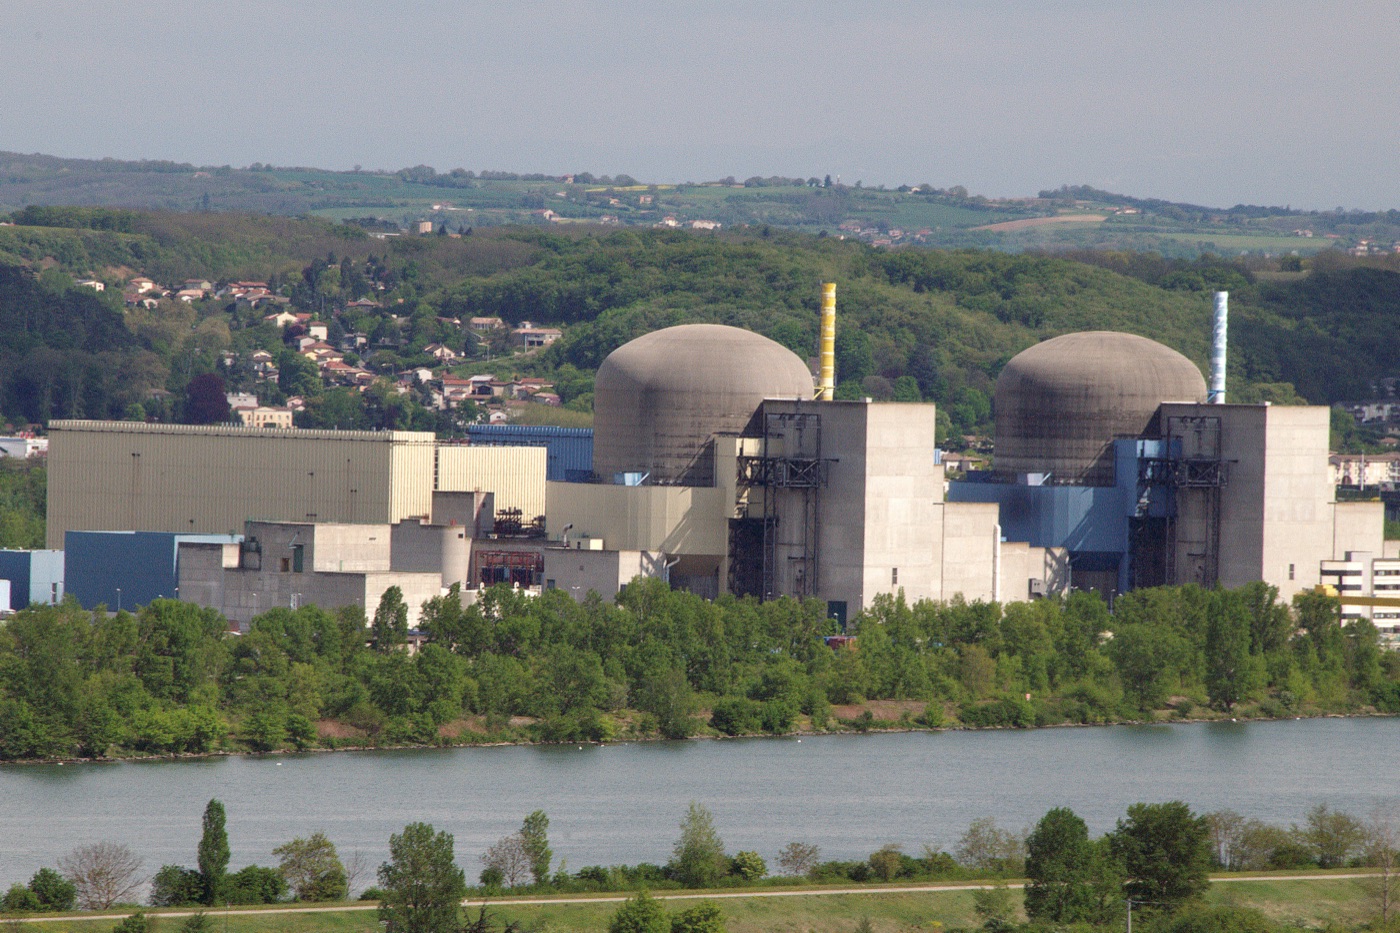
Image: Wikimedia Commons · CC BY-SA 4.0.
Retail’s edge has never been information (institutions’ is broader, faster, deeper) — it’s a shorter action radius: no IC approval, no need to explain benchmark deviation, no 13F disclosure, no monthly LP reporting. This action-radius differential gets amplified into several months of reaction window near inflections.
Three concrete frameworks
- Find the next leg, not the current one. When NVDA is already covered by 47 sell-side reports, look at MU; when MU is also covered, look at ANET / AVGO; after that, look at CPU, liquid cooling, transformers, optics. “The obvious next step” remains unpriced because institutions are waiting for forward earnings — and you aren’t.
- Reason backward via industry → earnings → price. Institutions look at “earnings certainty,” but earnings are a lagging indicator of “industry.” So retail’s edge window is: the industry fact has already happened (orders / capacity / prices), but the earnings number hasn’t fully landed in GAAP. The 6–12-month gap is the reaction window. A simple checklist: ① upstream orders climbing? ② key components rising in price? ③ does the CEO use phrases like “unprecedented demand” on earnings calls? Three hits but the next-quarter EPS hasn’t been revised up — that’s the window.
- Don’t try to predict “the first leg.” The first leg of GPU is the hardest to call — it requires anticipating a black swan like ChatGPT. But once the first leg has run, the sequence of the next 4–5 legs is structural, requires no black-swan call, only patience to wait out inertia. “Riding inertia” is an order of magnitude easier than “predicting inflections.”
Reaction window · two operational boundaries
- Don’t chase the end of the first leg. When a lane is fully priced to forward 35× P/E, the institutional chase is over — your relative edge has vanished.
- Act before the second leg’s confirmation. The “confirmation signal” for the second leg is usually the first sell-side upgrade; within 12 weeks of that report, prices get rapidly absorbed by institutional repositioning. The window is after the industry fact has solidified + before the first upgrade report.
Retail’s reaction window is structurally “the institutional compliance lag − your judgment lag.” Institutional compliance lag is about 6–12 months; your judgment lag depends on whether you do your homework. The harder you work, the larger the differential.
Boundaries — when this playbook breaks
Not every bull market follows this script. Four common failure points:
- The “real inflection” has already passed. After the last leg of the relay, the cycle typically heads into overcapacity, price declines, collective CPU order cuts. Call for AI: if after mid-2026 we see server-CPU inventory build + HBM prices topping, that’s the signal the AI capex cycle is entering digestion. Once in digestion, all “next leg” logic reverses.
- Institutions arrive early. When a story has been on the institutional watch list for years (e.g., the post-2008 recovery, EVs in 2014–2018), institutions arrive faster than expected. AI was a black swan, so reaction was slow; but coming themes like “humanoid robotics” and “autonomous driving” — already pitched for 10 years — will see faster reaction and a tighter window.
- Policy / geopolitical shocks. Russia–Ukraine 2022, H20 export controls 2025 — events like these scramble the relay order; sometimes upstream (energy) moves first, sometimes endpoints (consumer) do. The playbook isn’t absent, it’s perturbed.
- “The next leg runs” ≠ “who wins is set.” The CPU leg running doesn’t necessarily mean INTC rallies — it could be AMD taking all the incremental share; the power leg running may favor CEG over VST. Each leg requires fresh research to pick the winners within the lane.
A relay race existing doesn’t mean the winners are predetermined. “The next leg will run” is knowable; “which horse wins” needs fresh homework every time.
Bottom line
- Institutional inertia is structural, not individual choice. Regulation + benchmark + agency — three constraints make institutional capital naturally lag industry facts by 6–12 months, and the next value-chain leg by 12–24 months.
- The AI capex cycle amplifies that lag into a clean relay. GPU (2023) → power (2024) → memory (late-2024 to 2025) → networking (2025) → CPU (2025 Q4 → ?) — each leg lags the prior by 12–24 months.
- Retail’s edge is reaction speed, not information. The information gap has been closed by the internet, but the action-radius gap is structural and won’t shrink. It’s one of the few structural sources of alpha retail can keep tapping.
- Ride inertia, don’t chase inflections. The first leg’s inflection is hard to call; the sequence after it is almost a law of physics. Patience beats cleverness.
Apple’s real advantage in the AI era isn’t “we can also build models,” it’s “we don’t need to” (see /zh/signals/apple-ai); NVIDIA’s real danger isn’t “someone is catching up,” it’s “it can’t slow down” (see /zh/signals/nvda-moat). What this note adds is the other side — the whole market’s response to all of this is itself slow, and “slow” is the opportunity.
— Contrarian research · 2026-05-06
References — ownership · retail behavior · active vs. passive
- IR Impact — research on small-cap institutional ownership share. ir-impact.com
- Voronoi — S&P 500 ownership-structure visualization. voronoiapp.com
- JPMorgan Chase Institute — a decade of retail investing behavior since 2015. jpmorganchase.com
- S&P Dow Jones Indices, SPIVA U.S. Scorecard — active-management win-rate tracking. spglobal.com